Home dashboard
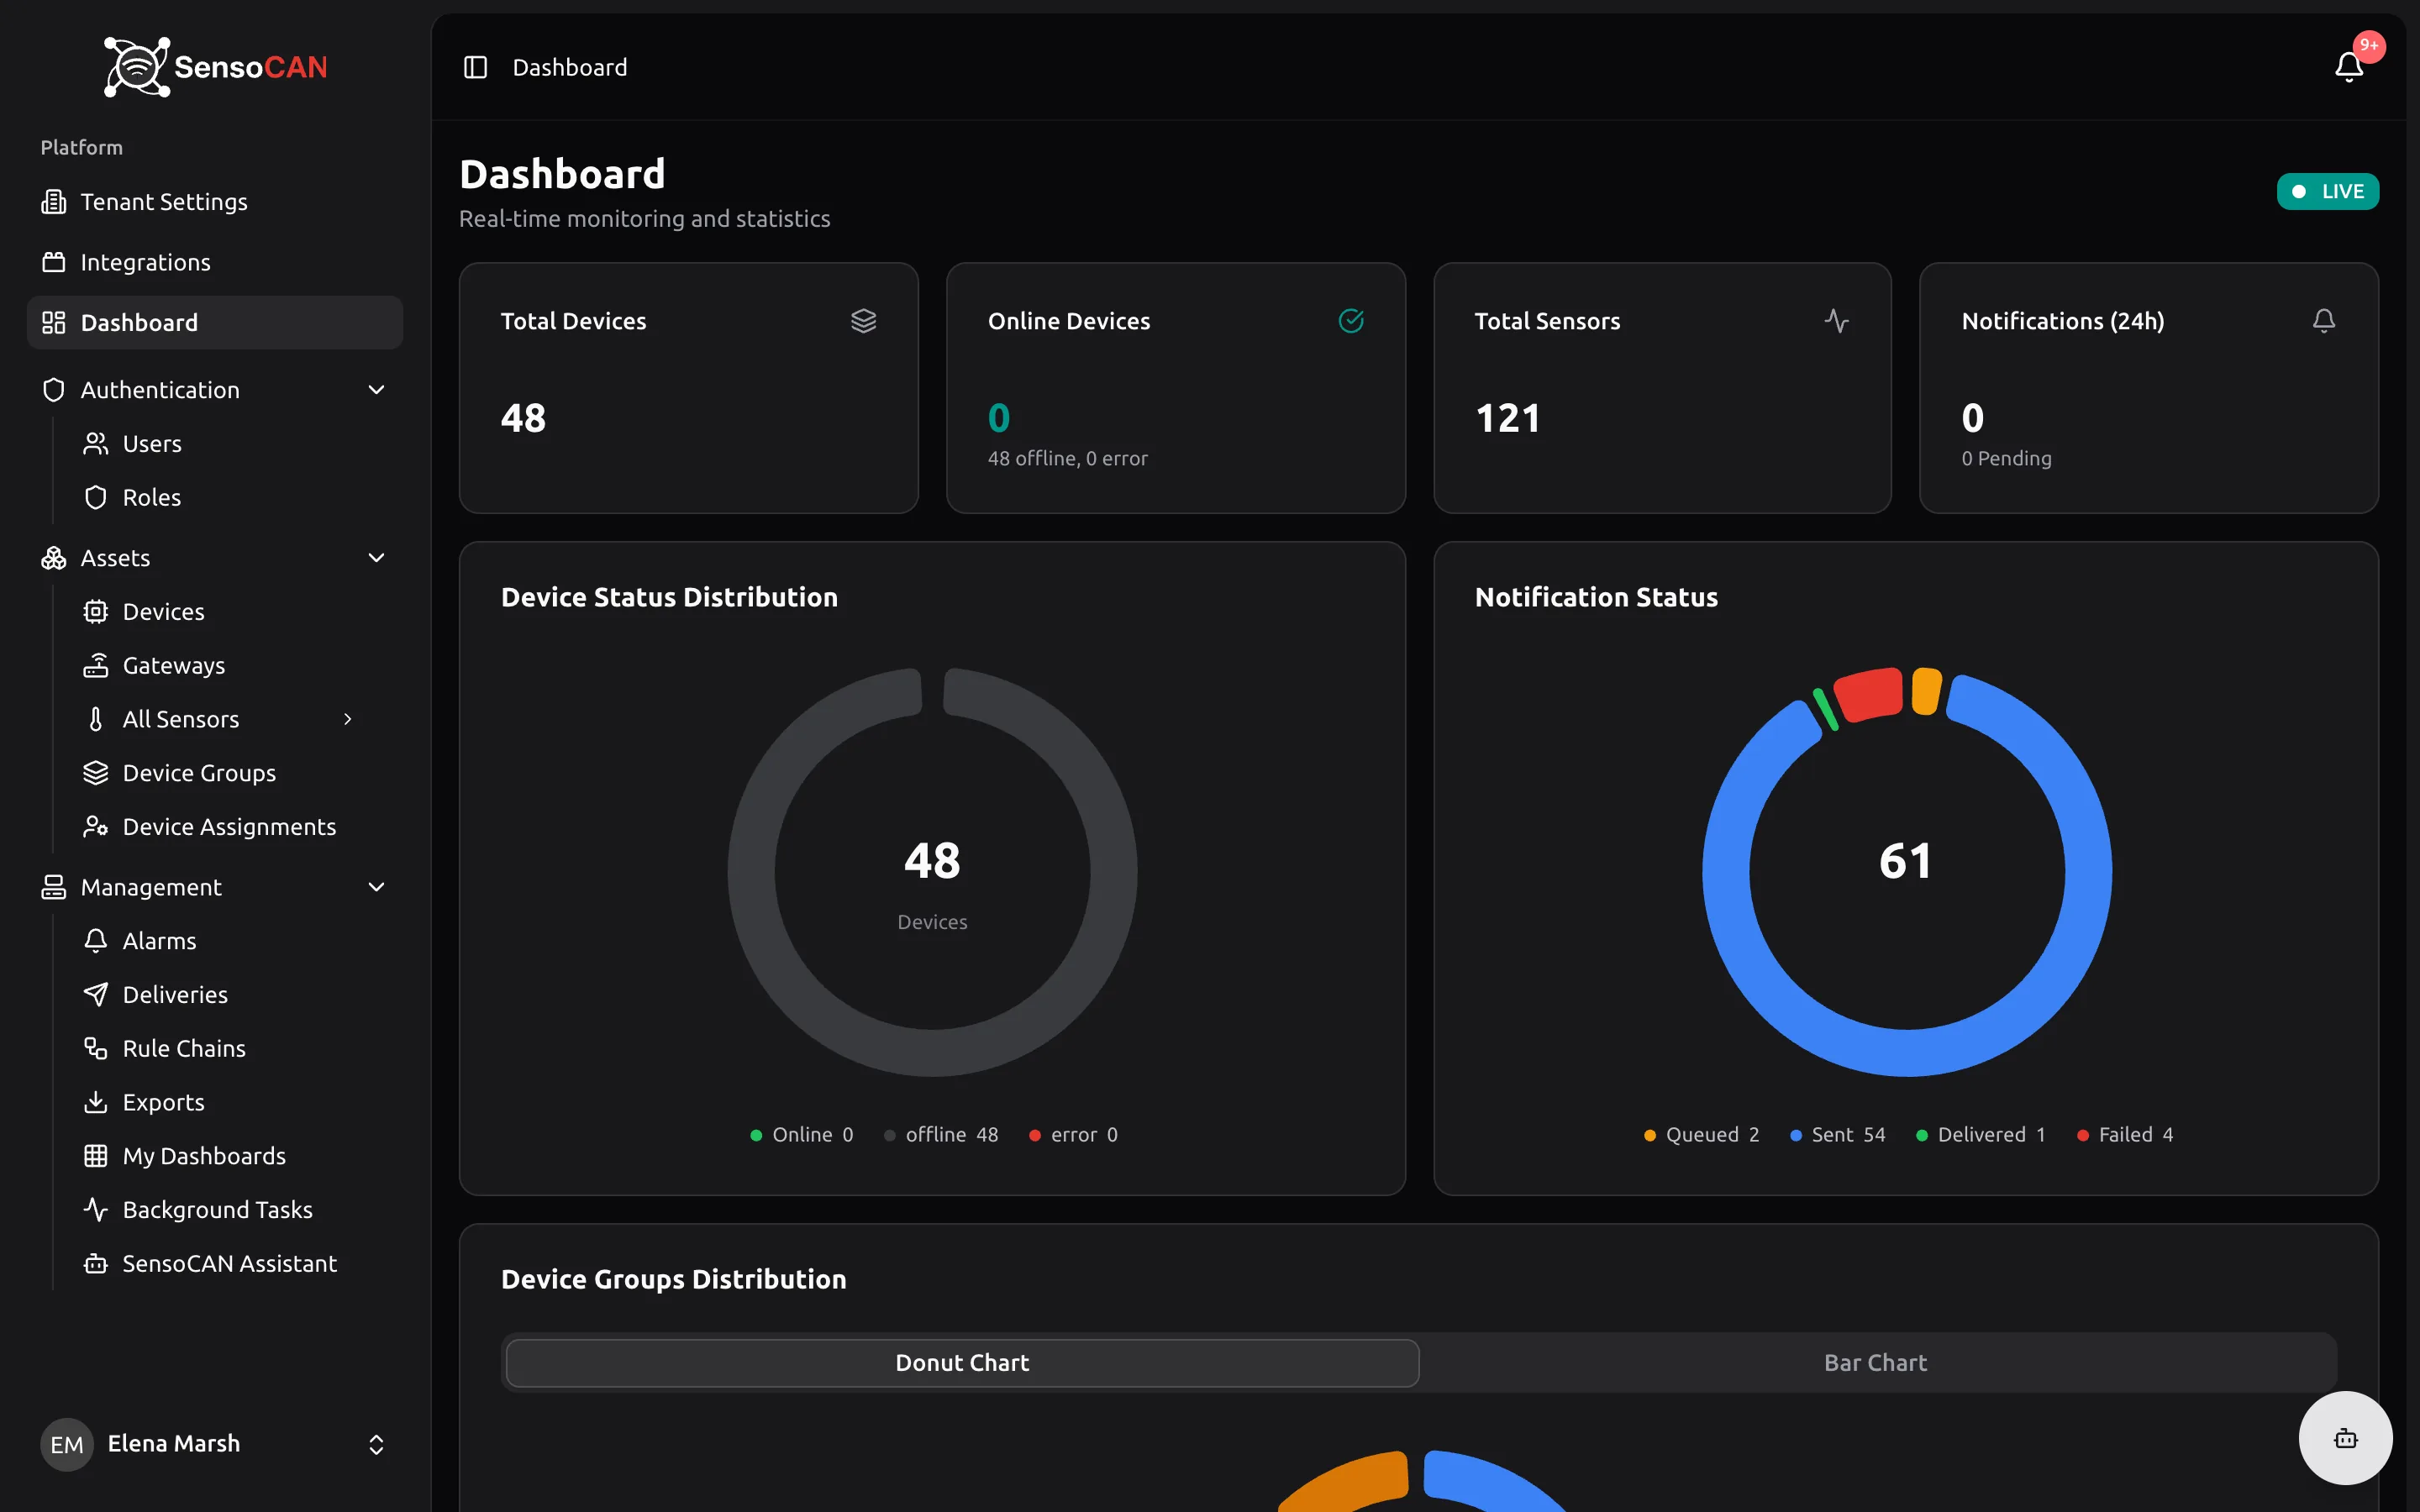
Dashboard is the first page you land on after signing in. It is a fixed overview of your organisation, subtitled "Real-time monitoring and statistics" and refreshed as data arrives. When the live connection is up, a LIVE badge appears in the header.
"Give me a summary of my organisation right now." — the assistant answers from your own data, in the app or in Slack. See Ask SensoCAN.
Unlike My Dashboards, this page is not editable. It always shows the same set of cards and charts, filtered to what your role allows you to see.
Summary cards
Across the top sit counters for Total Devices, Online Devices (with a line beneath giving how many are offline and how many are in error) and Total Sensors. They update as devices connect and disconnect, so they are the quickest way to spot that something has dropped off the network. From there, Devices gives you the detail.
Charts
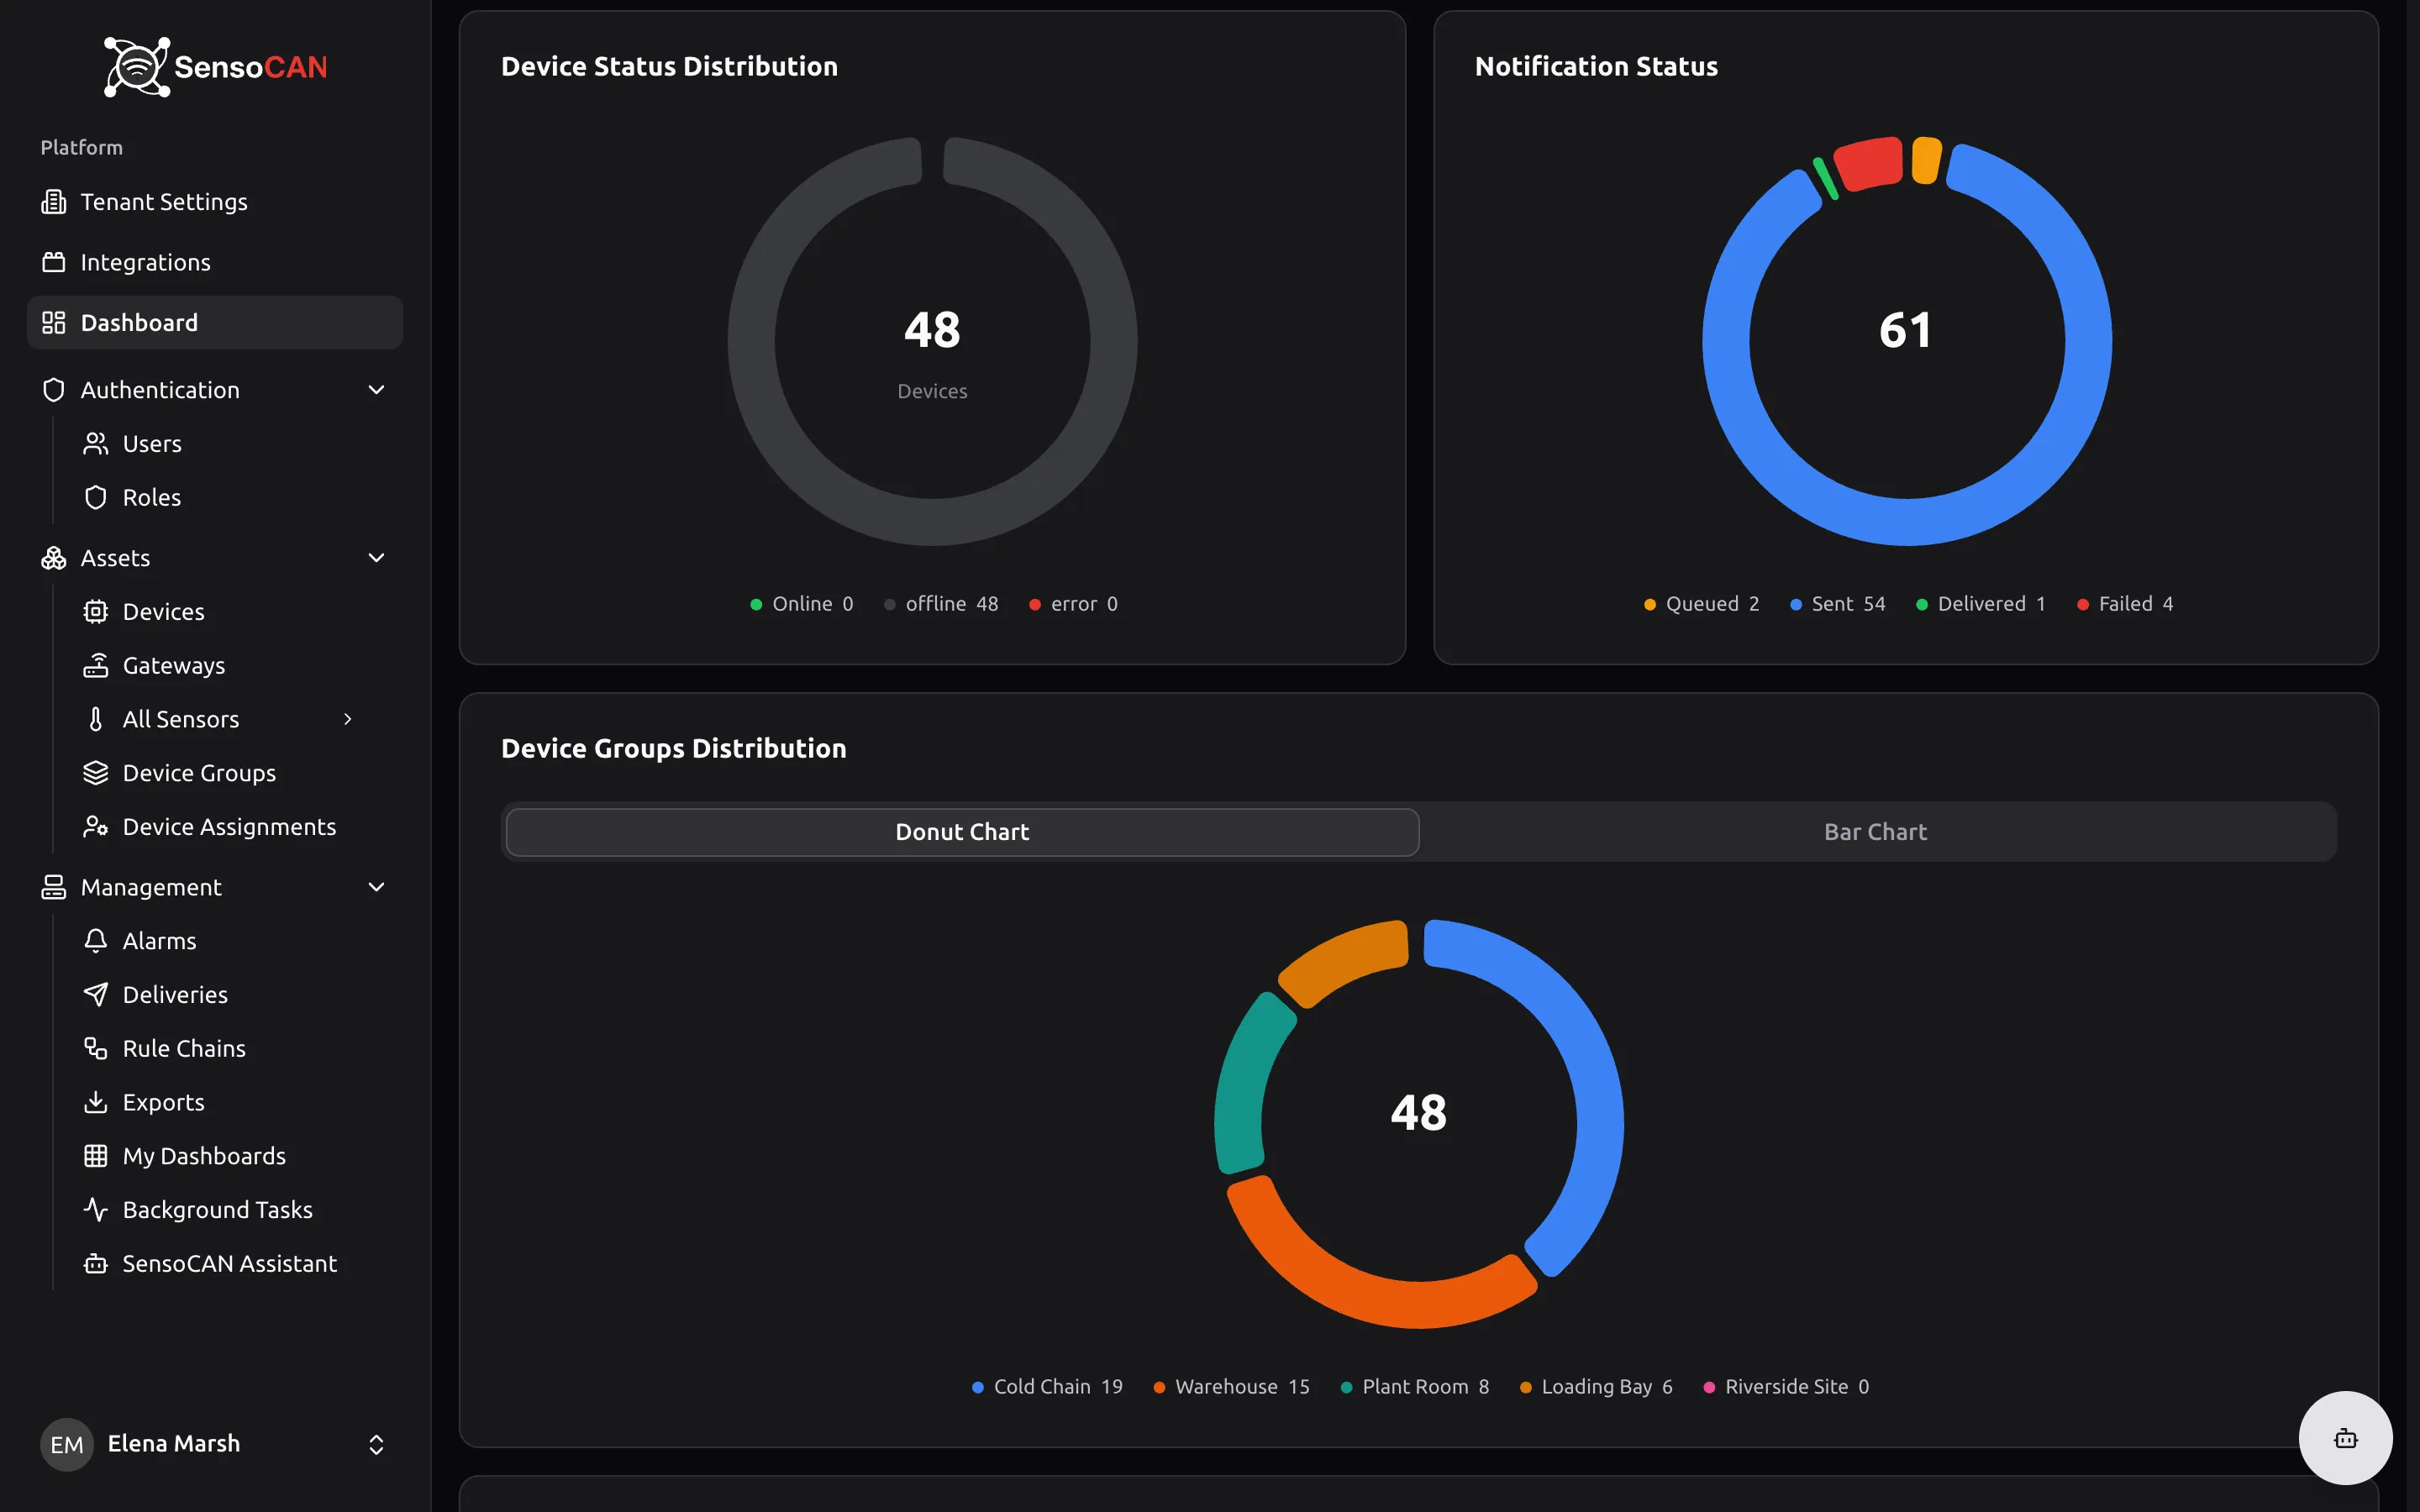
Device Status Distribution — a donut splitting your fleet into online, offline and error devices. Empty state: "No devices reporting yet".
Sensor Activity Timeline (Last 24h) — a line of how many readings arrived each hour over the last day. A healthy fleet gives a fairly even line; a sudden dip usually means a gateway or device stopped reporting. Empty state: "No sensor readings received yet".
Top 10 Sensors by Activity (Last 24h) — a bar ranking of your busiest sensors by number of readings, limited to sensors you are allowed to see. Empty state: "No sensor readings received yet".
Alert Trends (Last 30 days) — how many alarms were raised each day over the past month, so you can see whether a problem is getting worse or settling down. Follow it up in Alarms. Empty state: "No alerts triggered yet".
Notifications by Channel (Last 7 days) — stacked bars per day showing how many messages went out over email, SMS and WhatsApp. Empty state: "No notifications sent yet".
Notification Status — a donut of delivery outcomes across queued, sent, delivered and failed. A growing failed slice is worth investigating in Deliveries. Empty state: "No notifications sent yet".
Device Groups Distribution — the number of devices in each device group, plus an Ungrouped slice for devices that belong to none. Tabs let you switch between Donut Chart and Bar Chart. Empty states: "No device groups created yet" when you have not built any groups, or "No devices assigned to groups yet" when the groups exist but are empty.
Empty states and errors
Every chart shows its own message when there is nothing to draw, as listed above. A brand new organisation will therefore see a page of empty states rather than blank boxes, and each one fills in as soon as the first devices connect and start reporting.
If a chart cannot load at all, it shows Failed to load instead of its empty-state message. That distinction matters: an empty state means "nothing to show yet", while Failed to load means the data could not be fetched and is worth a page refresh.
Timezone
Time-based charts are drawn in the timezone on your profile, not the server's. Two colleagues in different regions can therefore read slightly different day boundaries on Alert Trends and Notifications by Channel from the same underlying data.
If the days on these charts look shifted, check the timezone on your profile in Account settings.