Rule Chains
A rule chain is a visual workflow that every incoming reading passes through. It decides whether the reading is stored, whether an alarm is raised or cleared, and who gets messaged. The page describes itself as "Visual workflows for processing sensor data": boxes joined by lines, evaluated once per reading.
Find them under Management → Rule Chains.
How a reading flows through a chain
- A reading arrives from your device (see Device Connectivity).
- SensoCAN matches it to a sensor and picks exactly one chain — the one assigned to that sensor's device if it is active, otherwise your organisation's default rule chain.
- The reading enters at the Sensor Input node and travels down the connections.
- Each node hands the reading to one of its named outputs, and a connection only carries readings whose output label matches it.
- Reaching a Save to Database node writes it; never reaching one does not.
Two consequences matter. An output left unconnected drops every reading that leaves through it, with no warning at run time. And a node that errors halts only its own branch.
Your device is told its readings were accepted the moment they arrive, before any chain runs. If the chain that applies has no Save to Database node on the path the reading took, the data is accepted and then thrown away. A device whose chain is inactive, or which has no applicable chain, stores nothing.
The Default Rule Chain
Every organisation starts with a chain named Default Rule Chain: a Sensor Input node wired straight to a Save to Database node. It exists so a device with no chain of its own still keeps its data.
Your default is chosen in the Default Rule Chain field under Settings → Tenant (Organization Settings). It is required, and only an active chain can be chosen. It cannot be deactivated ("It is what stores data for devices without their own rule chain") or deleted — nor can any chain assigned to devices. If it is ever inactive or missing, affected device pages show a red warning that data is not being stored, and the failure log records the dropped readings as Inactive chain.
Editing the default is normal; most organisations grow it into a real workflow. Just keep a path to Save to Database for everything you want to keep.
Assigning chains to devices
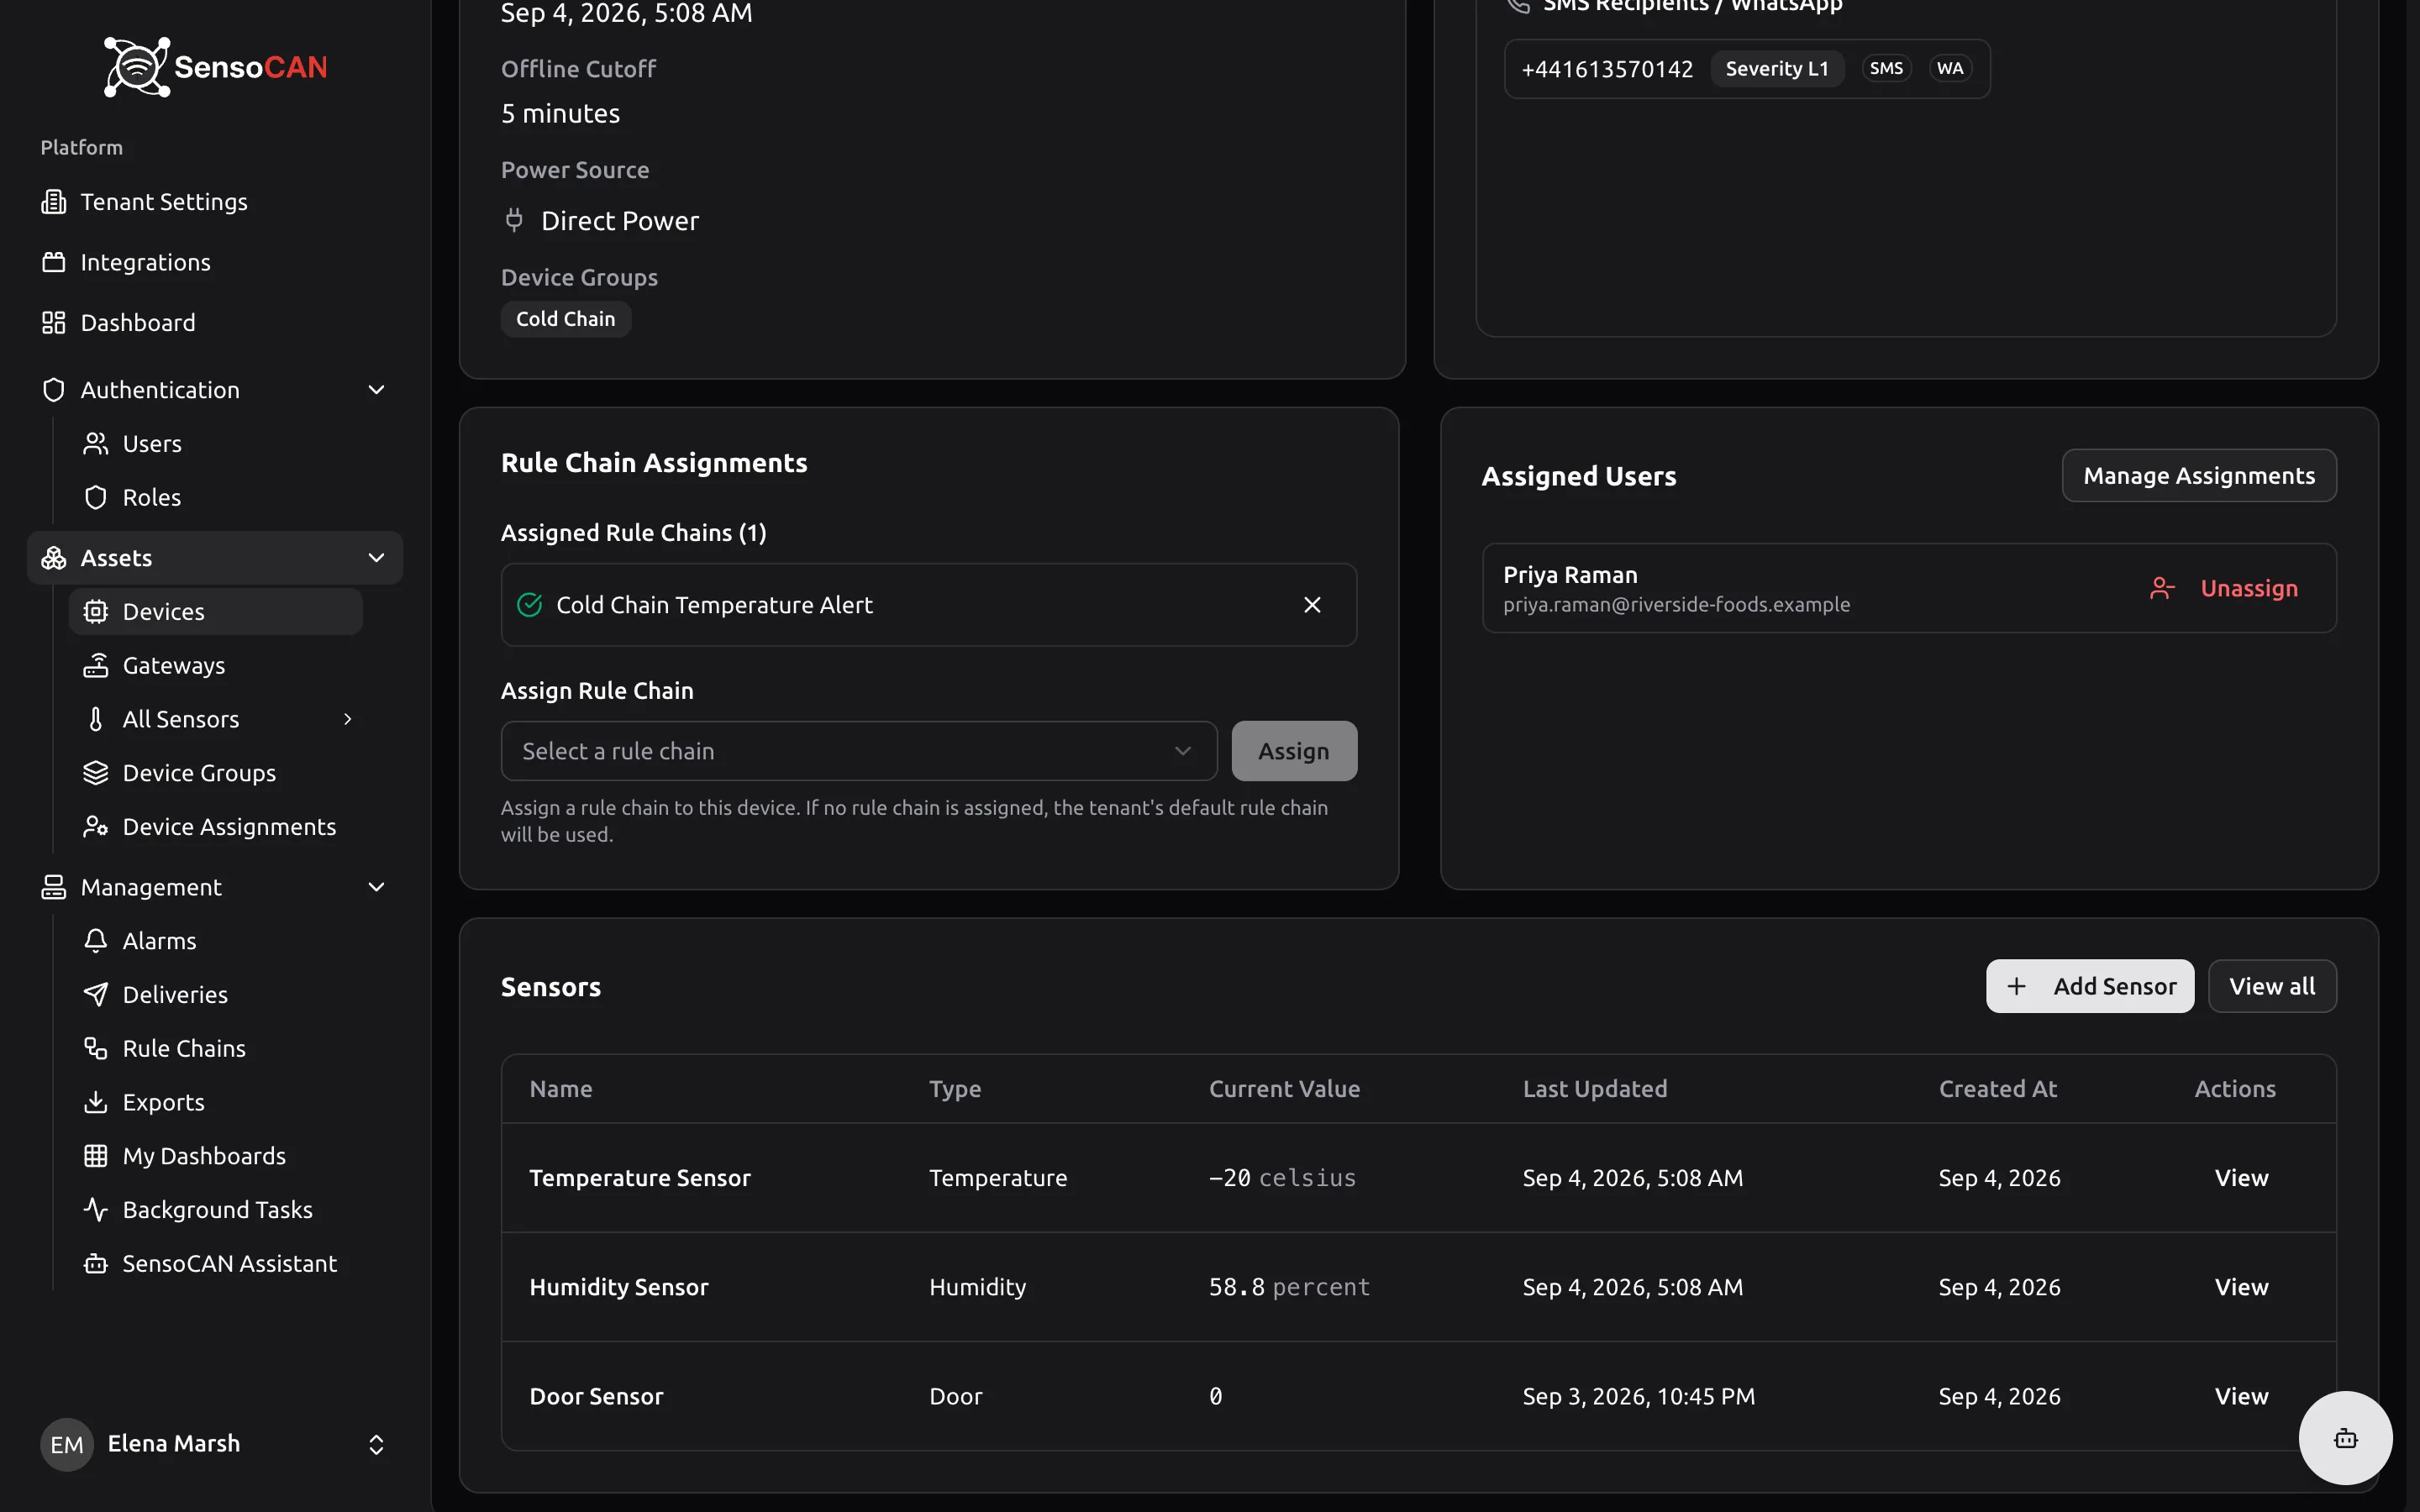
Open a device and find the Rule Chain Assignments card. With nothing assigned it says the tenant default "will be applied automatically because this device does not have any rule chains assigned". To assign one, pick from Select a rule chain and press Assign; only active chains are listed, and an inactive one is refused with "This rule chain is inactive and cannot be assigned to devices. Activate it first." The X beside an assignment removes it, and the device falls back to the default. Chains apply per device, so every sensor on a device shares one.
The Rule Chains page
The list shows Name, Description, Nodes, Failures, Status and Updated. Failures shows a red count linking to that chain's failure log, or a dash. The Status badge reads Active or Inactive and can be clicked to toggle. The row menu holds Edit Details, Edit Rule Chain, Activate / Deactivate and Delete; anything that would break a protected chain is disabled and says why underneath — "Tenant default rule chain", or "Assigned to 3 devices".
Create Rule Chain asks for Basic Information (Name, optional Description) and Template (Optional): Blank Canvas, High Temperature Alert, Humidity Range Monitor, After Hours Door Alert, Rapid Change Detection or Temperature Alarm with Recovery. Every new chain — templated or blank — arrives with a Sensor Input and a Save to Database node already in place.
That template is a plain "value above 30" check feeding an email. For genuine rate-of-change work, build with the Value Change node instead.
The visual editor
A toolbar sits across the top, the Node Palette on the left, the canvas in the middle and a configuration panel on the right.
The palette is headed "Node Palette — Click to add nodes", with a Search nodes... box and four expandable categories, each showing its node count: Filters, Enrichment, Transform, Actions. Click a node to drop it on the canvas. Sensor Input and Save to Database are absent, because every chain already has exactly one of each.
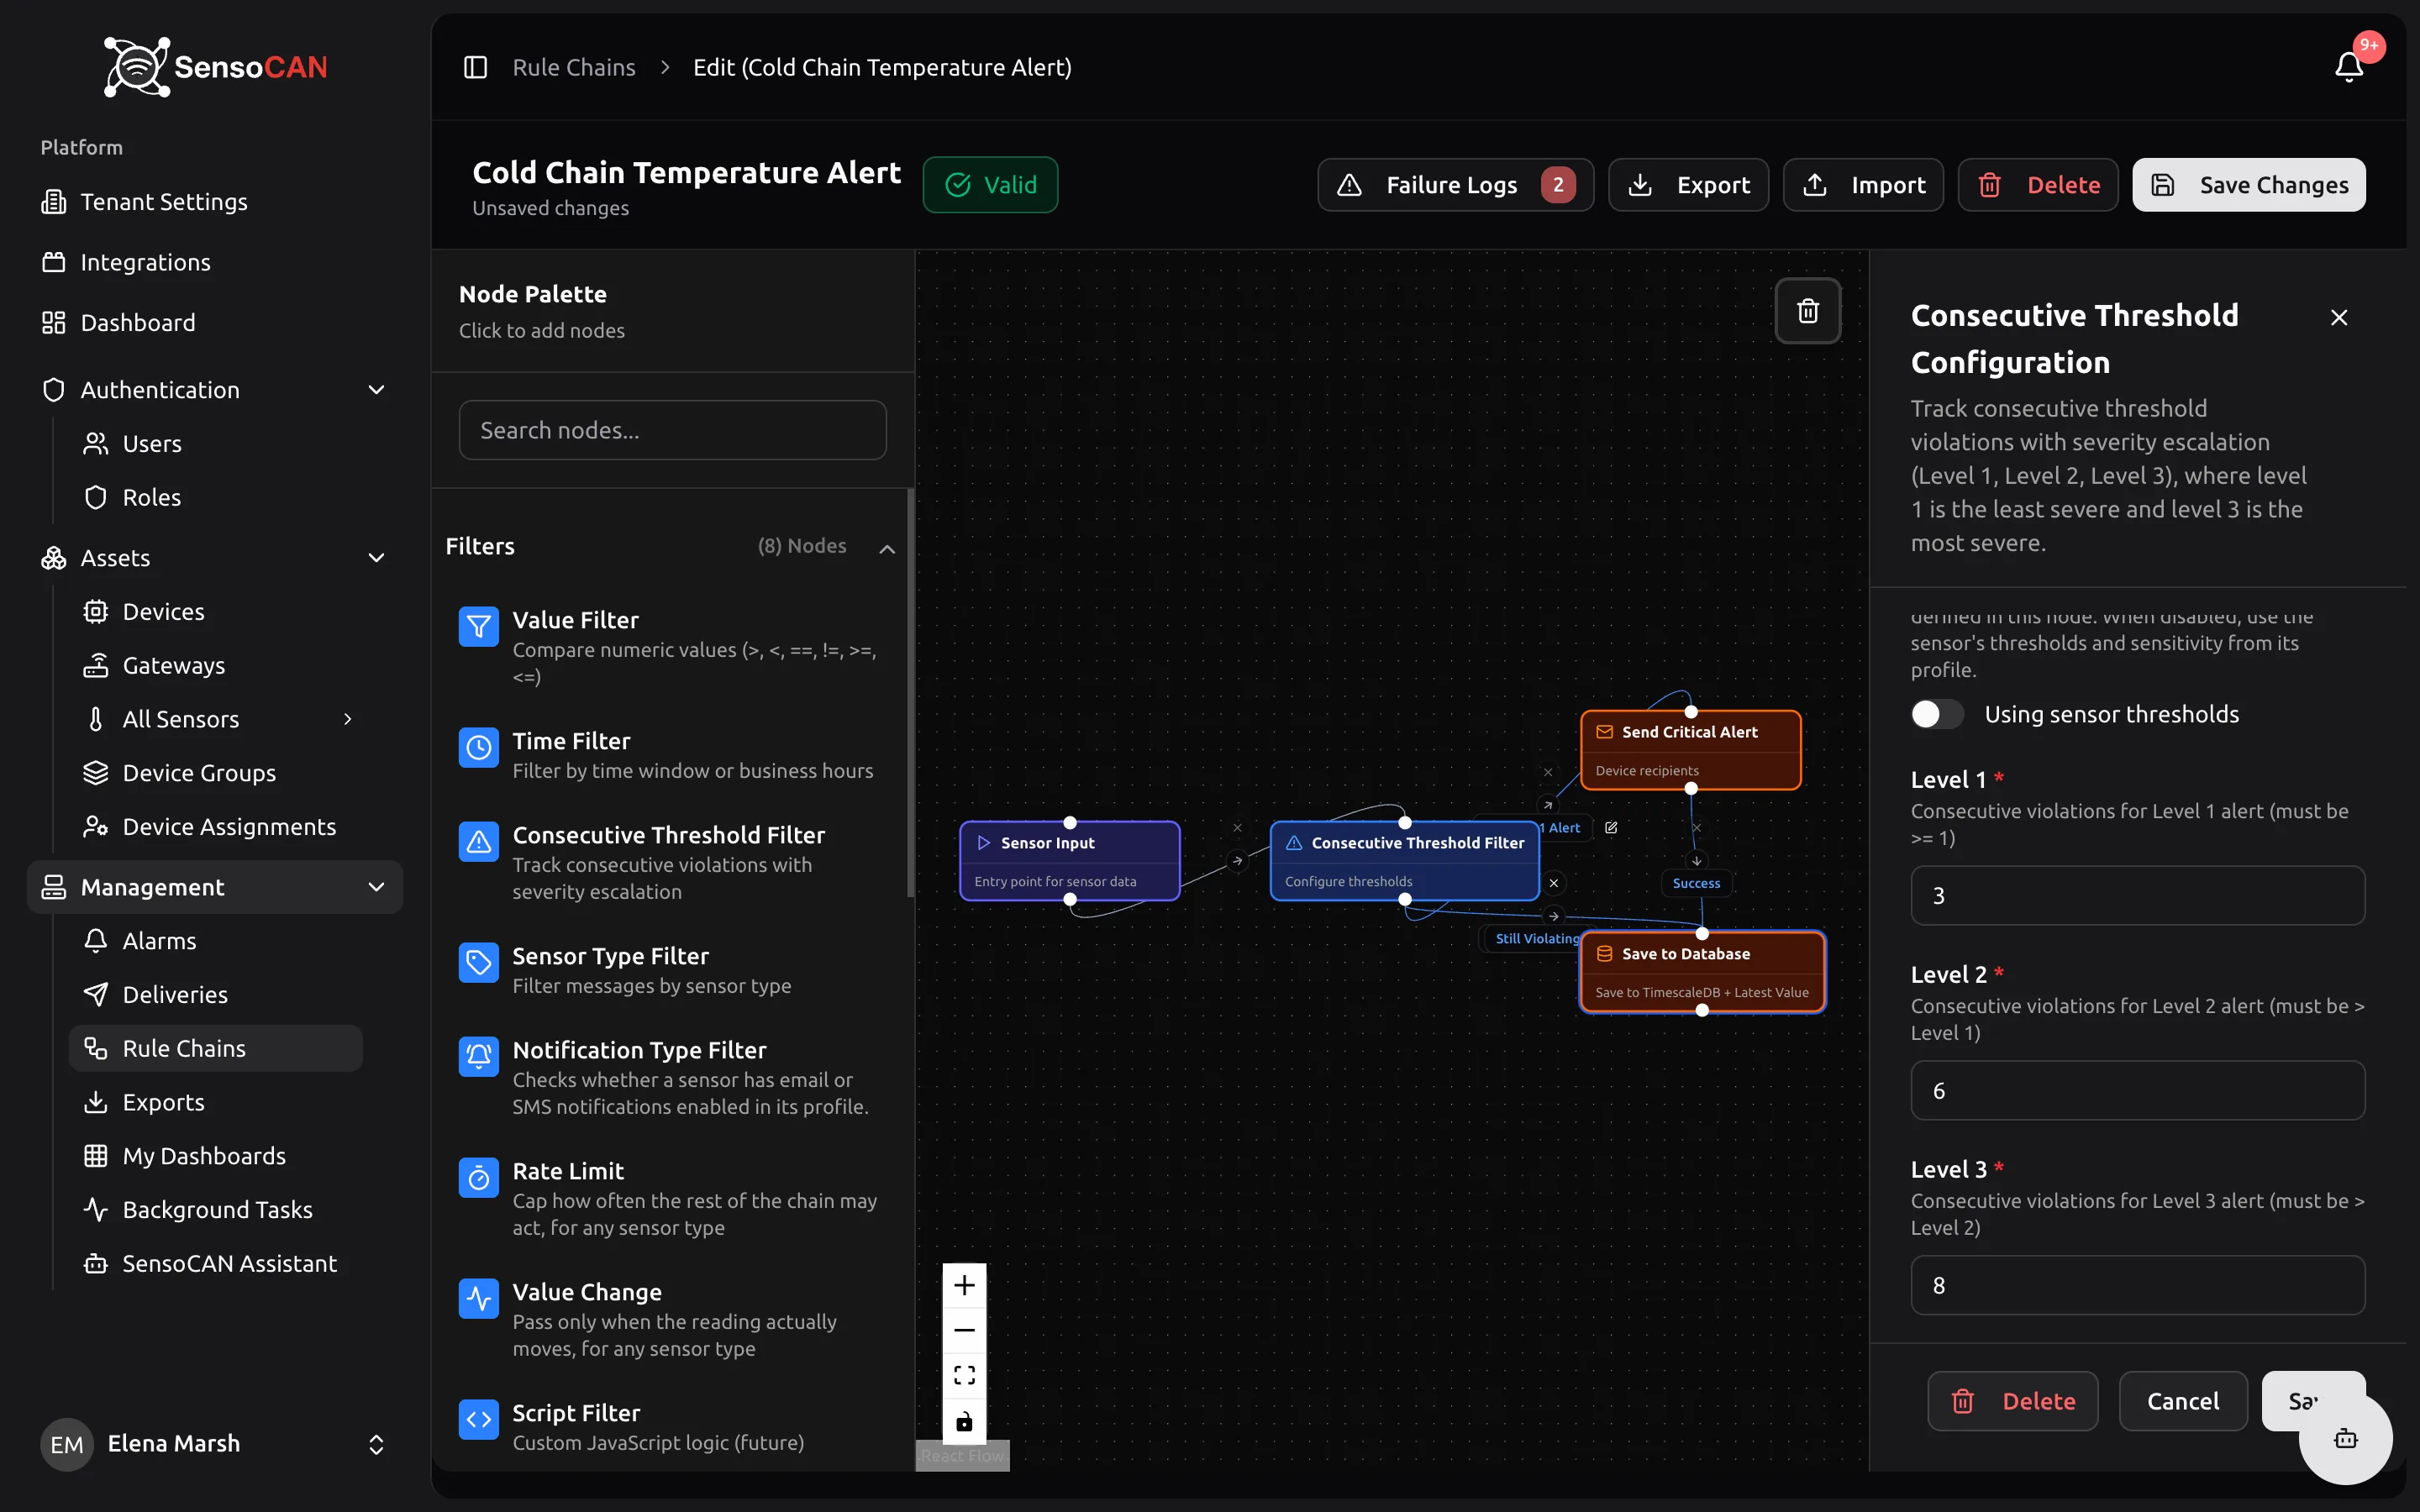
Connecting nodes. Drag from a node's output handle onto another node. The connection is labelled automatically with the source's first output, or Success for a node with only one. Where a node has several outputs the connection shows a label chip and a pencil, and the pencil opens Edit Connection with a Route Based On dropdown listing every output. The X deletes a connection. Delete or Backspace removes a selected node, except Sensor Input and Save to Database: "This node cannot be deleted. It is required for the rule chain to function."
The configuration panel reads "Select a node to configure" until you click one, and its Save is disabled while the panel lists errors. The toolbar shows the chain name, an Unsaved changes hint, and a chip reading Valid or a count of errors (red) or warnings (yellow) — errors block saving, warnings do not. It also holds Failure Logs with a count badge, Export, Delete and Save Changes.
What the Sensor Input panel tells you
Every reading enters the chain here and is passed to the connected nodes. There is nothing to configure. Readings are only stored by a Save to Database node — every path whose data you want to keep must end at one.
Where readings get lost: a filter output that is left unconnected drops every reading that leaves through it. The alert filter sends each reading down exactly one output — during an ongoing breach most readings leave through Still Violating, which is easy to leave unwired. A device with no rule chain, or one whose chain is inactive, stores nothing at all.
The "alert filter" it means is the node named Consecutive Threshold Filter in the palette.
Node reference
Every node type is listed here. Nodes route down True or False unless other outputs are named.
Sensor Input
Input. The entry point — every reading arrives here and passes to the connected nodes. No settings. Added to every chain automatically, cannot be deleted, and not in the palette. It stores nothing itself.
Value Filter
Filters. Compares the reading against a fixed value. Settings: Field Type (Numeric, String, Boolean); Operator — Greater than, Greater than or equal, Less than, Less than or equal, Equal and Not equal for numeric, Equals, Not Equals, Contains, Starts With and Ends With for string, Is True and Is False for boolean; and Value, needed for all but boolean. A missing value, or a non-numeric one in Numeric mode, routes False.
Time Filter
Filters. True when the reading's timestamp falls inside a daily window. Settings: Filter Type, which you should leave on Business Hours; Use Sensor Profile Hours, which takes the window from the sensor profile and falls back to the times below; Start Time and End Time (09:00 and 17:00). The window is judged within one day, so 22:00 to 06:00 never matches, and there is no day-of-week setting.
Consecutive Threshold Filter
Filters. Counts consecutive breaches and escalates through three levels, so one stray reading raises nothing. Outputs: Severity 1 Alert, Severity 2 Alert, Severity 3 Alert, No Alert, Recovered, Still Violating. Settings: Use Node Thresholds — on, this node's values apply; off, the sensor profile's do. Then Min Threshold and Max Threshold (empty for none), with Min Sensitivity and Max Sensitivity as tolerance margins outside them; and always Level 1, Level 2 and Level 3 consecutive counts (3, 5 and 8 by default, each higher than the last). Each level fires once as it is first reached, further breaches leave through Still Violating, and a reading back in range after an alert leaves through Recovered. The severity it works out is what Raise Alarm reads as "From threshold".
Sensor Type Filter
Filters. True when the reading came from a sensor of a chosen type. Setting: Sensor Type. With none selected, everything passes as True.
Notification Type Filter
Filters. Checks whether the sensor's profile has email or SMS notifications switched on before the reading continues. Setting: Notification Type, Email or SMS. A sensor with no profile passes as True; a profile with the flag off routes False.
Rate Limit
Filters. Lets one reading through per cooldown window, so a chain cannot flood anybody. Outputs: Passed ("Outside the cooldown — the message continues") and Suppressed ("Inside the cooldown — wire storage here"). Setting: Cooldown (seconds), 300 by default, from one second to 24 hours. The window is held per sensor per node, so two chains watching one sensor have separate budgets. Suppressed readings are routed, not dropped — wire Suppressed to storage so a cooldown never costs you data.
Value Change
Filters. Passes a reading only when it has moved since the last one that passed. Outputs: Changed and Unchanged. Setting: Deadband, "the largest move to ignore, in the sensor's own units" — leave it at 0 for a door or any on/off reading. The first reading always passes. Unlike Rate Limit, a sensor sitting still passes nothing however long it sits, so wire Unchanged to storage to keep the full history.
Script Filter
Filters. Evaluates an expression you write and routes on the result. Setting: Expression — "Return true to pass, false to filter out. Available variables: msg, metadata, value, type." A Validate button checks the syntax. Example: value > 30 and msg["status"] == "active". An empty expression passes everything as True; one that fails at run time routes False. The palette still calls this JavaScript; the panel is the accurate one. It is an expression, not a script — no return, and no statements.
Add Metadata
Enrichment. Attaches fixed key/value pairs to the reading. Settings: Metadata Fields, key and value rows, with Add Field for more. Every key becomes usable as a {key} placeholder in messages further down the chain.
Fetch Attributes
Enrichment. Looks up stored attributes and attaches them. Settings: Data Source (Sensor, Device or Sensor Profile) and Attributes, the names to fetch. Values arrive as {enrichment_<source>_<attribute>}, for example {enrichment_device_location}. Attribute names are the underlying field names, not the labels shown on screen.
Transform Value
Transform. Rewrites the reading's value for everything downstream, Save to Database included. Settings: Field Type (Numeric, String, Boolean); Operation — Multiply, Divide, Add, Subtract, Round and Absolute value for numeric, Append, Prepend, Replace, Uppercase, Lowercase and Trim for string, Negate for boolean; and Operand where the operation needs one. A Result preview shows the effect, and dividing by zero is refused. Place this node before storage only when you want the converted value stored.
Send Email
Actions. Emails the reading's recipients. Settings: Use Device Recipients ("Send to recipients configured on the device"); Select Labels — Default, Severity L1, Severity L2, Severity L3, at least one when using device recipients; Additional Recipients for extra addresses; and optional Subject and Message. Left blank, the subject is "Rule Chain Alert" and the body "Rule chain notification triggered". With no recipients at all the node does nothing and the reading continues. Every attempt appears on the Deliveries page.
Send SMS
Actions. The same settings as Send Email, with phone numbers and no subject: Use Device Recipients, Select Labels, Additional Recipients in international format such as +1234567890, and an optional Message. Device recipients are the phone recipients with the SMS channel ticked.
Send WhatsApp
Actions. Settings: Use Device Recipients ("Send to WhatsApp-enabled phone numbers configured on the device"), Select Labels, Additional Recipients, and Message Type — Sensor Alert Template (Official), which fills in Sensor Name, Sensor Value and Device Name for you, or Custom Free-form Text, which only works within the 24-hour conversational window. Device recipients are the phone recipients with the WhatsApp channel ticked.
Push Notification
Actions. Sends a push notification to the mobile devices registered for your organisation. Settings: an optional Subject title and a Message, both accepting placeholders. It goes only where push is enabled for the organisation and the device's Push Notifications switch is on. Tapping it opens the alarm if the chain raised one, otherwise the sensor or device. Push is not listed on the Deliveries page.
Raise Alarm
Actions. Opens a condition somebody has to acknowledge. Outputs: Raised or escalated ("New alarm, or an existing one got worse") and Already open ("An open alarm absorbed this message"). Settings: Alarm Type, the identity of the condition such as high_temperature; Severity — From threshold, Warning, Major or Critical; and Message, shown on the alarms page, Alarm on {sensor_name} by default. Raising the same type for the same source while one is open increments its trigger count instead of making a second alarm, and severity only ever climbs. "From threshold" reuses the level the Consecutive Threshold Filter worked out, falling back to Warning. Wire messaging to Raised or escalated to be told once rather than on every reading. See Alarms.
Clear Alarm
Actions. Marks the condition resolved. Outputs: Cleared and Nothing open ("Normal on every reading after the first recovery"). Setting: Alarm Type, which must match the Raise Alarm node that opened the condition. Clearing is not closing — an alarm nobody acknowledged stays open after it clears.
Acknowledge Alarm
Actions. Lets the chain take responsibility for a condition automation genuinely handles on its own. Outputs: Acknowledged and Nothing open. Setting: Alarm Type, matching the Raise Alarm node. The alarms page then shows "by rule chain name" rather than a person.
Save to Database
Actions. Writes the reading. Settings: two Data Stores checkboxes — Time Series Database, the history that charts, exports and analytics read, and Latest Sensor Value, the current reading on dashboards and the live updates you see without refreshing. Added to every chain automatically, cannot be deleted, not in the palette. Unticking Latest Sensor Value stops dashboards moving while history keeps recording.
Template variables in messages
Subjects and messages accept placeholders in single braces, {like_this}. Anything that cannot be resolved is removed from the finished message rather than printed literally.
The editor lists six beside every message field: {value} (the sensor value), {sensor.name}, {sensor.type}, {device.name}, {device.location} and {timestamp}. These work too, and more become available as the reading travels:
- Flat equivalents:
{sensor_name},{sensor_type},{sensor_id},{device_name},{device_location},{device_status},{device_id},{ts}. - Any key you added with Add Metadata, under its own name.
- Anything from Fetch Attributes:
{enrichment_sensor_…},{enrichment_device_…},{enrichment_profile_…}. - After a Consecutive Threshold Filter:
{thresholdSeverityLevel},{thresholdAlertType},{thresholdConsecutiveCount}. - After a Raise Alarm node:
{alarm_id},{alarm_type},{alarm_severity}. - Any extra key your device sent with the reading, such as
{battery_pct}.
The Failure Logs page
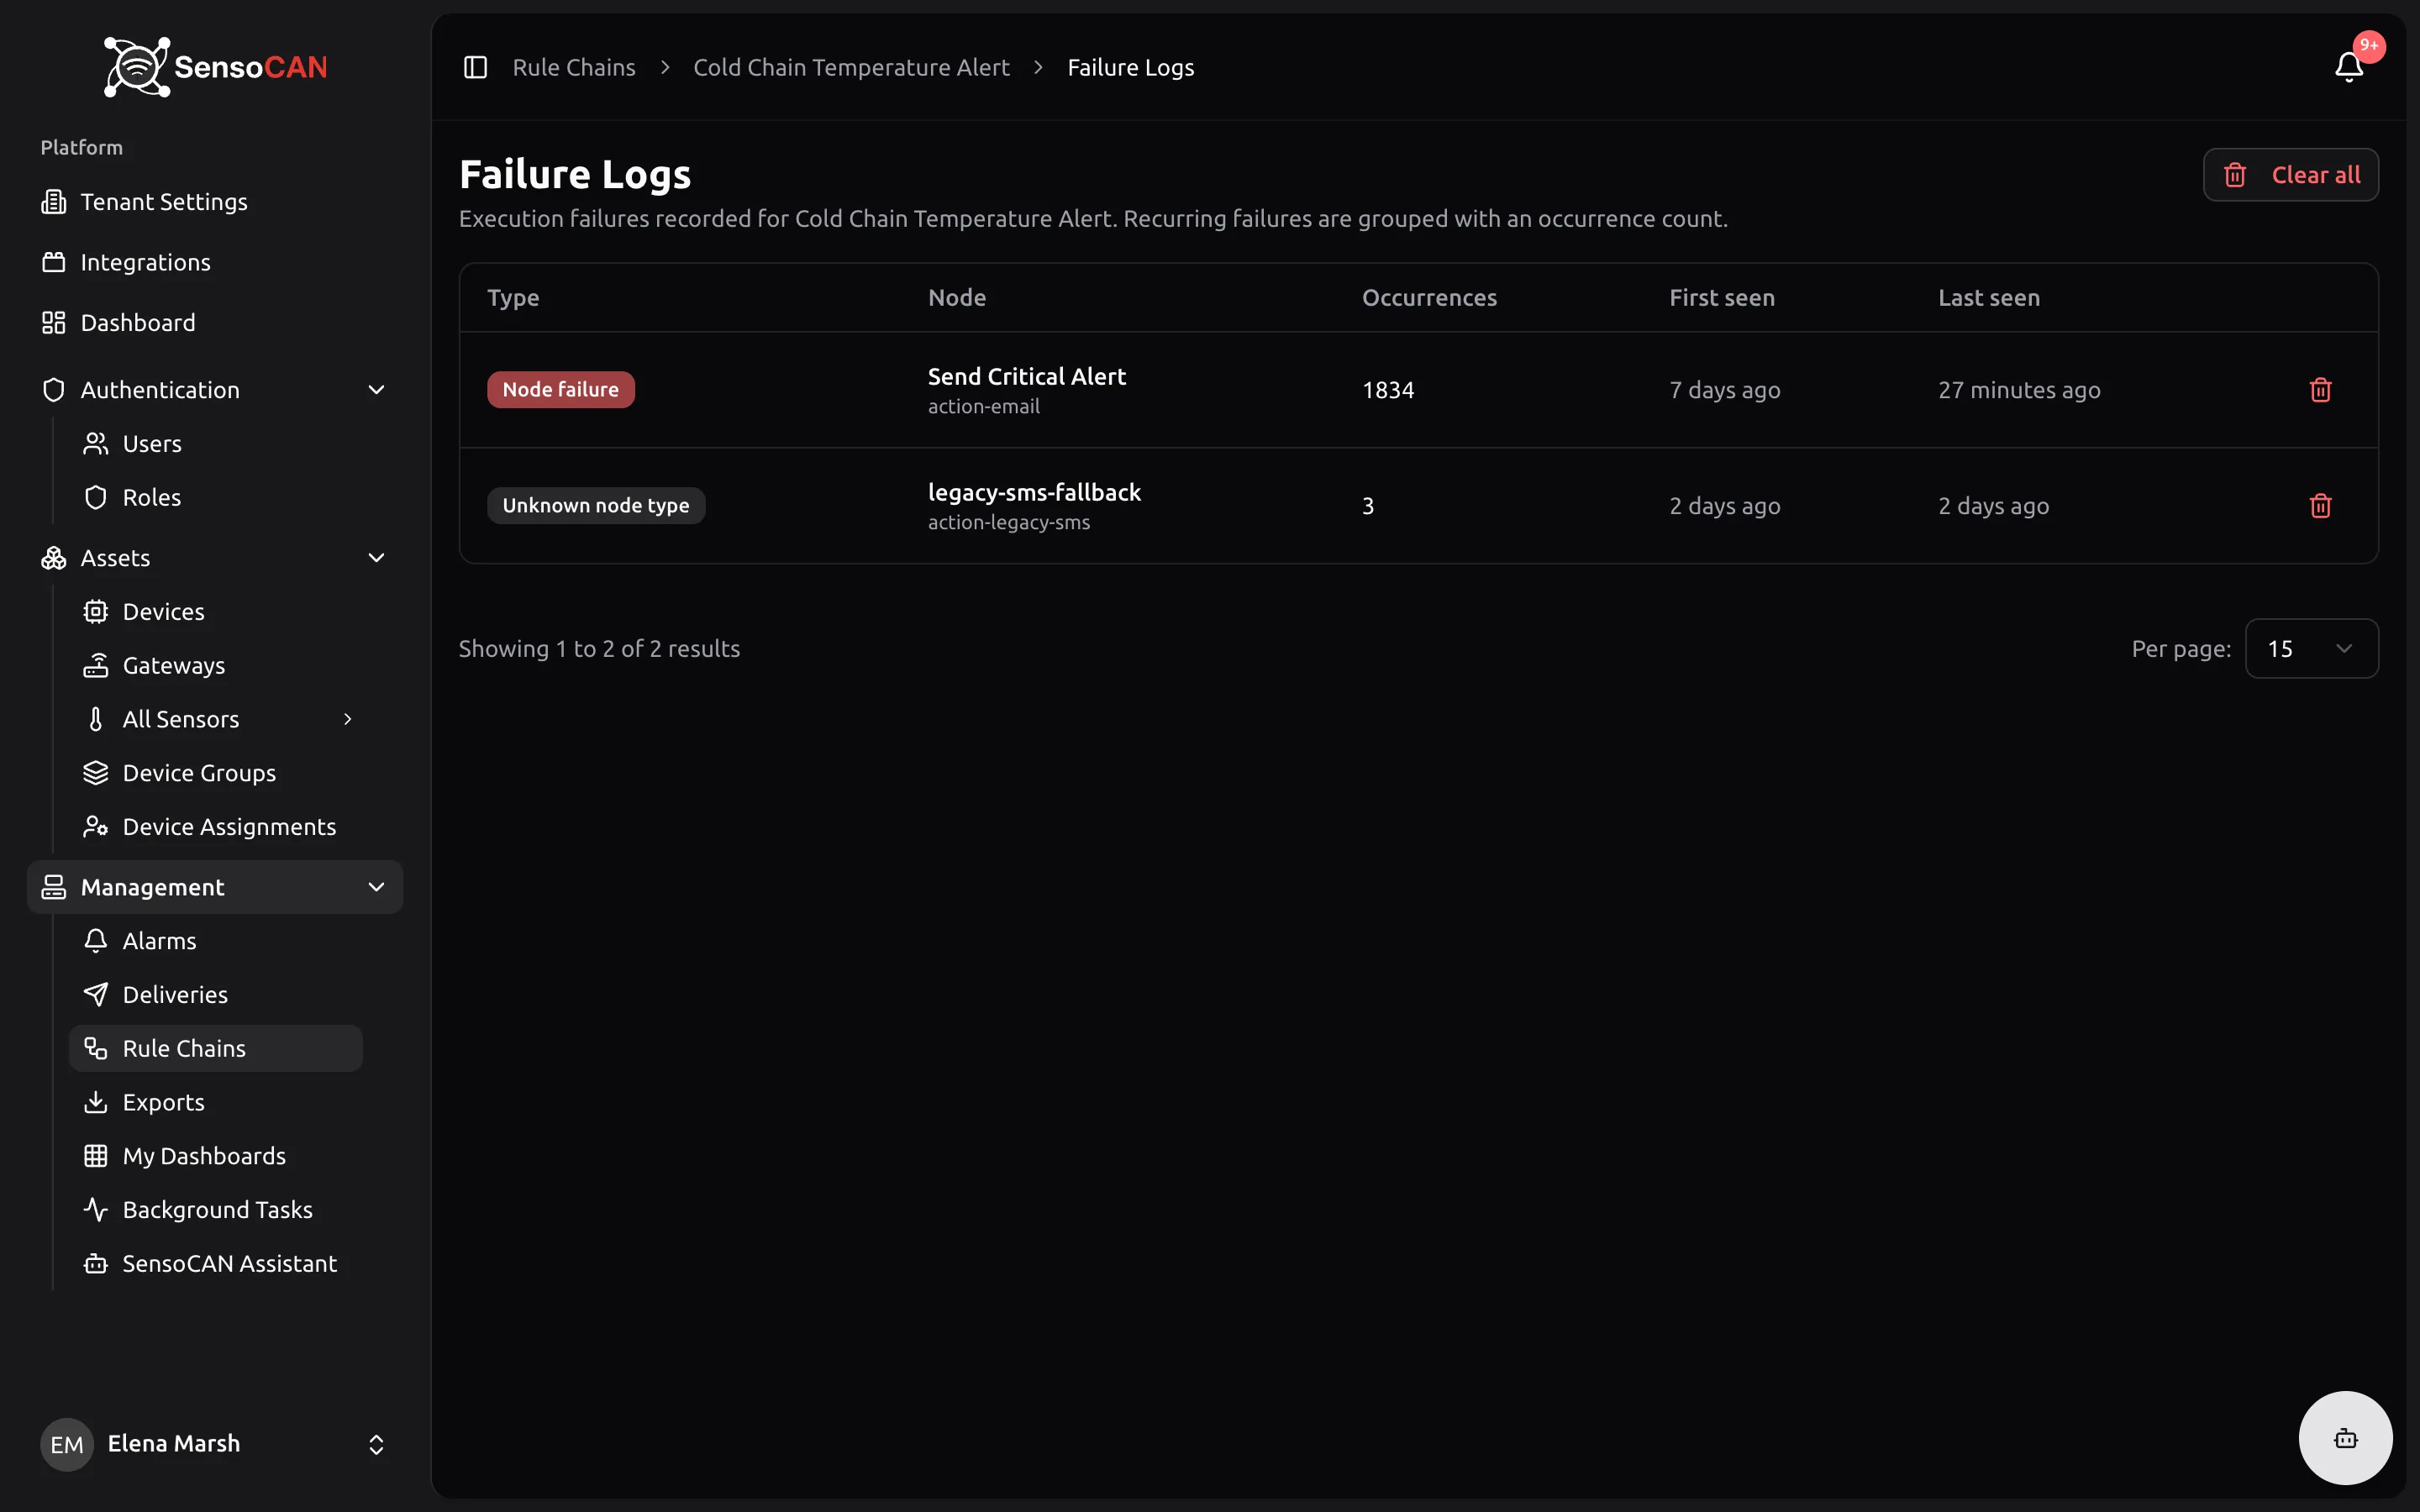
Reach it from the Failure Logs button in the editor or the red count in the Failures column. A failure is a reading the chain could not finish processing. Columns are Type, Node, Occurrences, First seen and Last seen.
Occurrences is the heart of the page. Identical failures are not listed twice: one row stands for one combination of chain, node and failure type, and every repeat raises the count and moves Last seen forward. A count in the thousands against a first-seen of last Tuesday means the problem is continuous, not historical.
| Type | What it means |
|---|---|
| Node failure | A node stopped its branch — usually a misconfigured setting |
| Invalid structure | The saved chain is no longer a valid graph |
| Missing entry node | The chain has no Sensor Input node |
| Invalid entry node | The chain starts on something other than an input node |
| Cycle detected | A branch looped back into a node it had already passed |
| Inactive chain | The chain that applied was inactive, so the reading was dropped |
| Unknown node type | A node the platform no longer recognises |
The first four are shown in red, because they mean data was lost.
With permission you can Dismiss one row ("It reappears if the failure happens again.") or Clear all. Dismissing fixes nothing — repair the chain first. When all is well the page reads No failures.
Permissions
Rule chains sit behind their own permissions, granted through roles.
| You need | To be able to |
|---|---|
| View rule chains | See the list and read the failure log |
| Edit rule chains | Open the visual editor, save, rename, activate or deactivate |
| Add rule chains | Use Create Rule Chain |
| Delete rule chains | Delete a chain, and dismiss or clear failure log entries |
| Assign rule chains | Attach a chain to a device |
| Unassign rule chains | Remove a chain from a device |
Opening the editor needs edit rule chains, not just view. With view only, the chain name is plain text rather than a link and the row menu is not shown — you get a read-only list.
By default Admin holds the whole set, while Manager and User hold none of it and so do not see Rule Chains in the sidebar.