Sensors
A sensor is one measurement channel on a device: a temperature, a humidity, a door contact. It is not a piece of hardware in SensoCAN's eyes — it is the address a reading is delivered to. Every sensor carries a name you choose, a slug and a UUID generated for you, and a sensor type that decides what its readings mean and which settings it has.
"What was the average temperature in Cold Room 2 over the last 7 days?" — the assistant answers from your own data, without opening this page. See Ask SensoCAN.
Firmware addresses a reading either by slug or by UUID; both are on the sensor's page. See Device Connectivity.
Sensor types
The type is the template: it fixes the unit choices, the thresholds and the monitoring settings a sensor gets, and it is chosen once, at creation. The platform ships the catalogue — temperature, humidity, current, pressure, door (contact and accelerometer) and water — and it is read-only.
Administrators can review it at Assets → All Sensors → Sensor Types, headed "Sensor Types — Reference sensor schemas and usage across devices". Each card gives the type's name, description and slug, how many sensors use it, and a Schema list of every field with its type, whether it is required, its minimum and maximum, its default and any fixed options.
A standard device may carry only one sensor of each type — one temperature, one humidity, and so on. A second attempt is refused with "This device already has a sensor of this type." Model a two-probe unit as two devices. Gateways are exempt, because their sensors stand in for the beacons they relay.
Add a sensor
From a device, open its page and use Sensors → Add Sensor. To start from anywhere, use Assets → All Sensors → Add Sensor, which asks for the Device first. With no devices yet you are told "No devices available. Create a device before adding sensors."
- Sensor Name (required) — up to 255 characters, letters, numbers, spaces, underscores and hyphens, and unique on that device.
- Sensor Type (required) — settable only while creating. Nothing can change it afterwards, so if you pick wrongly, delete the sensor and add it again.
Create Sensor flashes "Sensor created successfully". The slug and UUID are generated, and a profile is created for you filled with the type's defaults, so the sensor is ready to accept readings immediately.
Profiles and thresholds
The profile is where a sensor stops being generic. Open Edit Profile from the sensor's Profile card, its actions menu, or the Profile column on All Sensors. The page is headed "Profile Settings — Configure monitoring settings for" the sensor, with a Profile Configuration form and a collapsible Schema Reference — Available fields and their constraints.
Which fields appear depends on the type:
| Field | Appears on | What it sets |
|---|---|---|
| Unit | Temperature, humidity, current, pressure | The unit readings are interpreted and displayed in — Celsius or Fahrenheit, percent, ampere or milliampere, hPa, psi or bar |
| Minimum Threshold / Maximum Threshold | Measurement types | The band a reading is expected to stay inside. They drive the in-range badge and the coloured zones on the gauge |
| Minimum Sensitivity / Maximum Sensitivity | Measurement types | The margin either side of a threshold, so a reading sitting on the line does not flap |
| Voltage | Current | The supply voltage used to interpret current readings |
| Start Business Hours / End Business Hours | Door and water types | The working window, in HH:mm. The end must be at least 30 minutes after the start |
| Allowed open window | Door types | How long a door may stay open before it counts as a problem |
| Notification reminders | Door and water types | How many times to repeat an unresolved alert |
| Email Notifications / SMS Notifications | All types | Whether threshold alerts for this sensor go out by email and by SMS |
Each field is validated against the type's own range — a temperature threshold, for instance, lives between -40 and 85 — and against the others. Expect messages such as "Min Threshold must be less than Max Threshold.", "End Business Hours must be after Start Business Hours." and "The time difference between Start Business Hours and End Business Hours must be at least 30 minutes." Save Changes flashes "Sensor profile updated successfully".
Thresholds decide what a reading means; what happens next is the job of the sensor's rule chain. See Rule chains and Alarms.
The sensor page
Open a sensor from its device or from All Sensors.
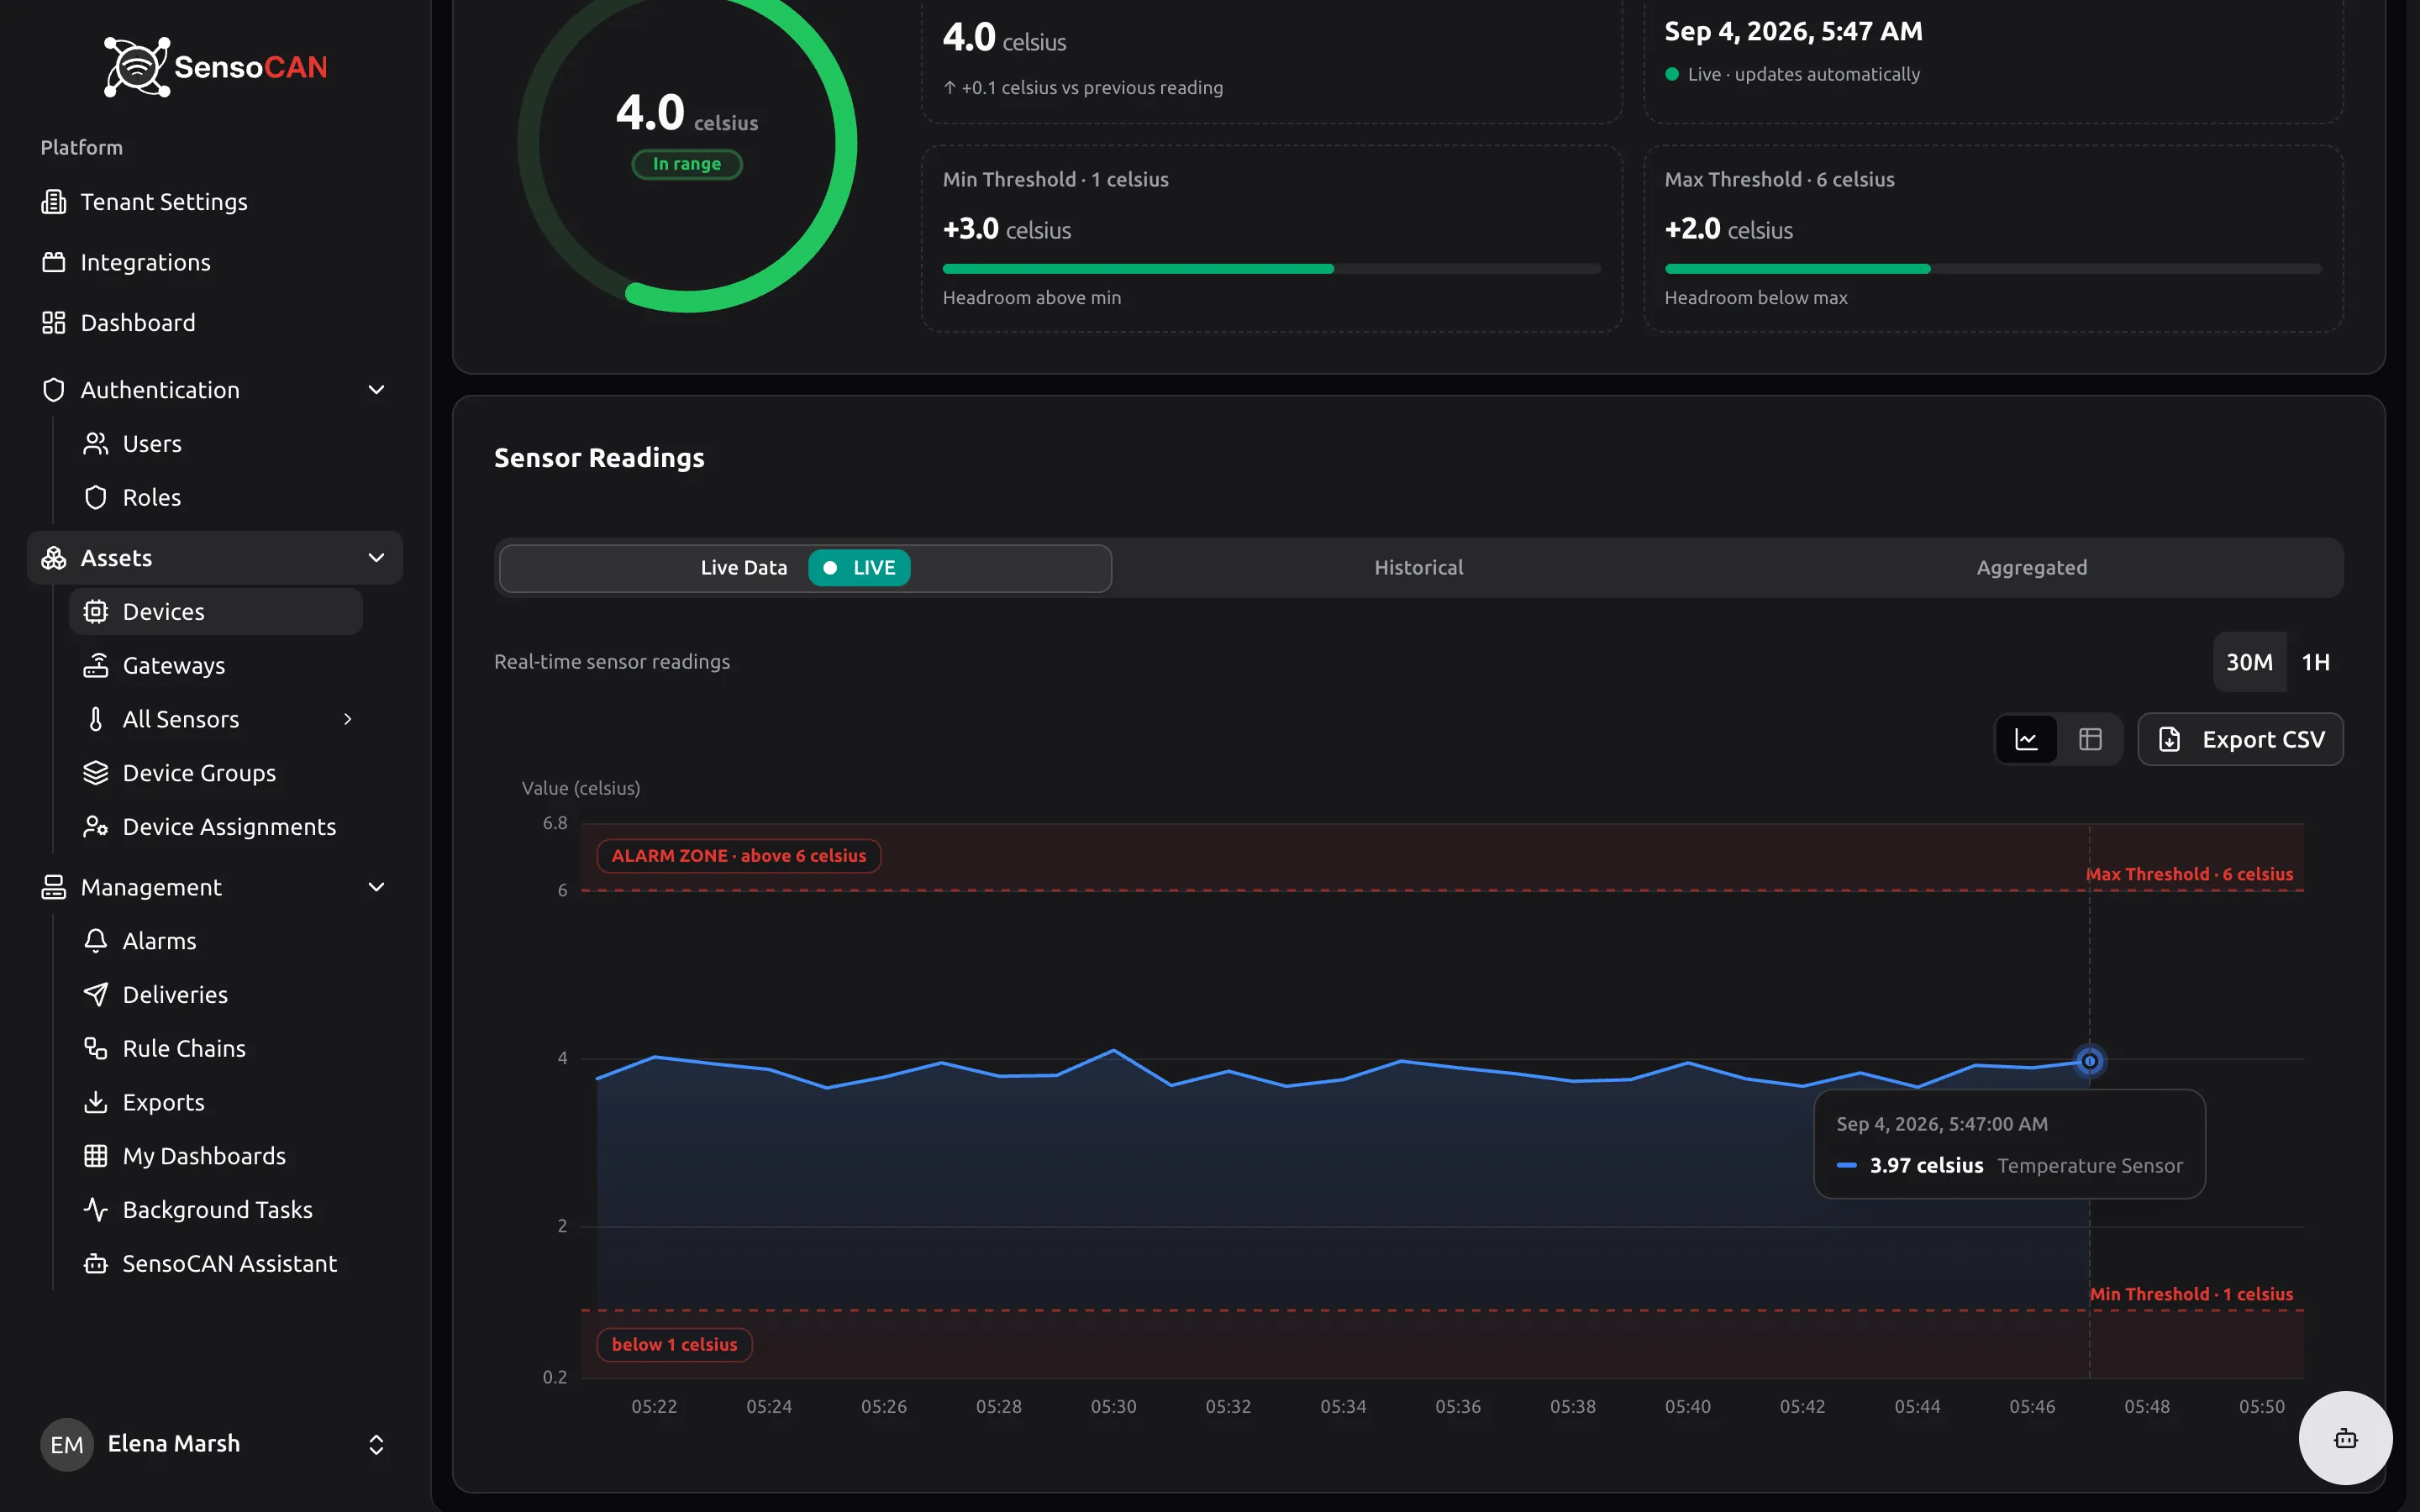
Information lists Name, Slug, UUID with a copy button, Type, Updated, and the sensor's own MQTT topic with a copy button.
Profile prints every profile field with its value — thresholds with their unit, switches as Enabled or Disabled badges — or "No profile configured".
Current Reading is the headline. Measurement sensors get a gauge, the current value with how it moved since the previous reading, the time of that reading marked "Live · updates automatically", and tiles showing the headroom left above the minimum and below the maximum threshold. A badge reads In range, Above max threshold or Below min threshold. The Gauge style menu offers Ring, Thermometer, Barometer, Segments, Value inside, Graded and Linear bar; your choice is saved with the sensor and is what everyone else sees too. Door sensors show Open or Closed instead of a gauge.
Sensor Readings holds three tabs:
- Live Data — real-time readings over a 30M or 1H window. The window slides forward on its own and new readings appear as they arrive, with no reload. Door sensors get a step chart shaded with their business hours.
- Historical — a date and time range, defaulting to the last seven days, with quick selects for 1 Hour, 24 Hours, 7 Days and 30 Days, then Load Data. An end before the start is refused with "End time must be after start time", and a very long range warns "Date range is very large. This may take a while to load." before loading anyway.
- Aggregated — the same range plus Aggregation: Hourly or Daily, returning the mean, minimum and maximum per bucket. This is the faster way to look at long periods.
Every chart can be flipped to a table, zoomed and panned, and exported as CSV for exactly the range on screen. For a formatted Excel or PDF file instead, use Export Data in the page header — see Exports.
The All Sensors page
Assets → All Sensors is the cross-device view: "View and manage all sensors across devices".
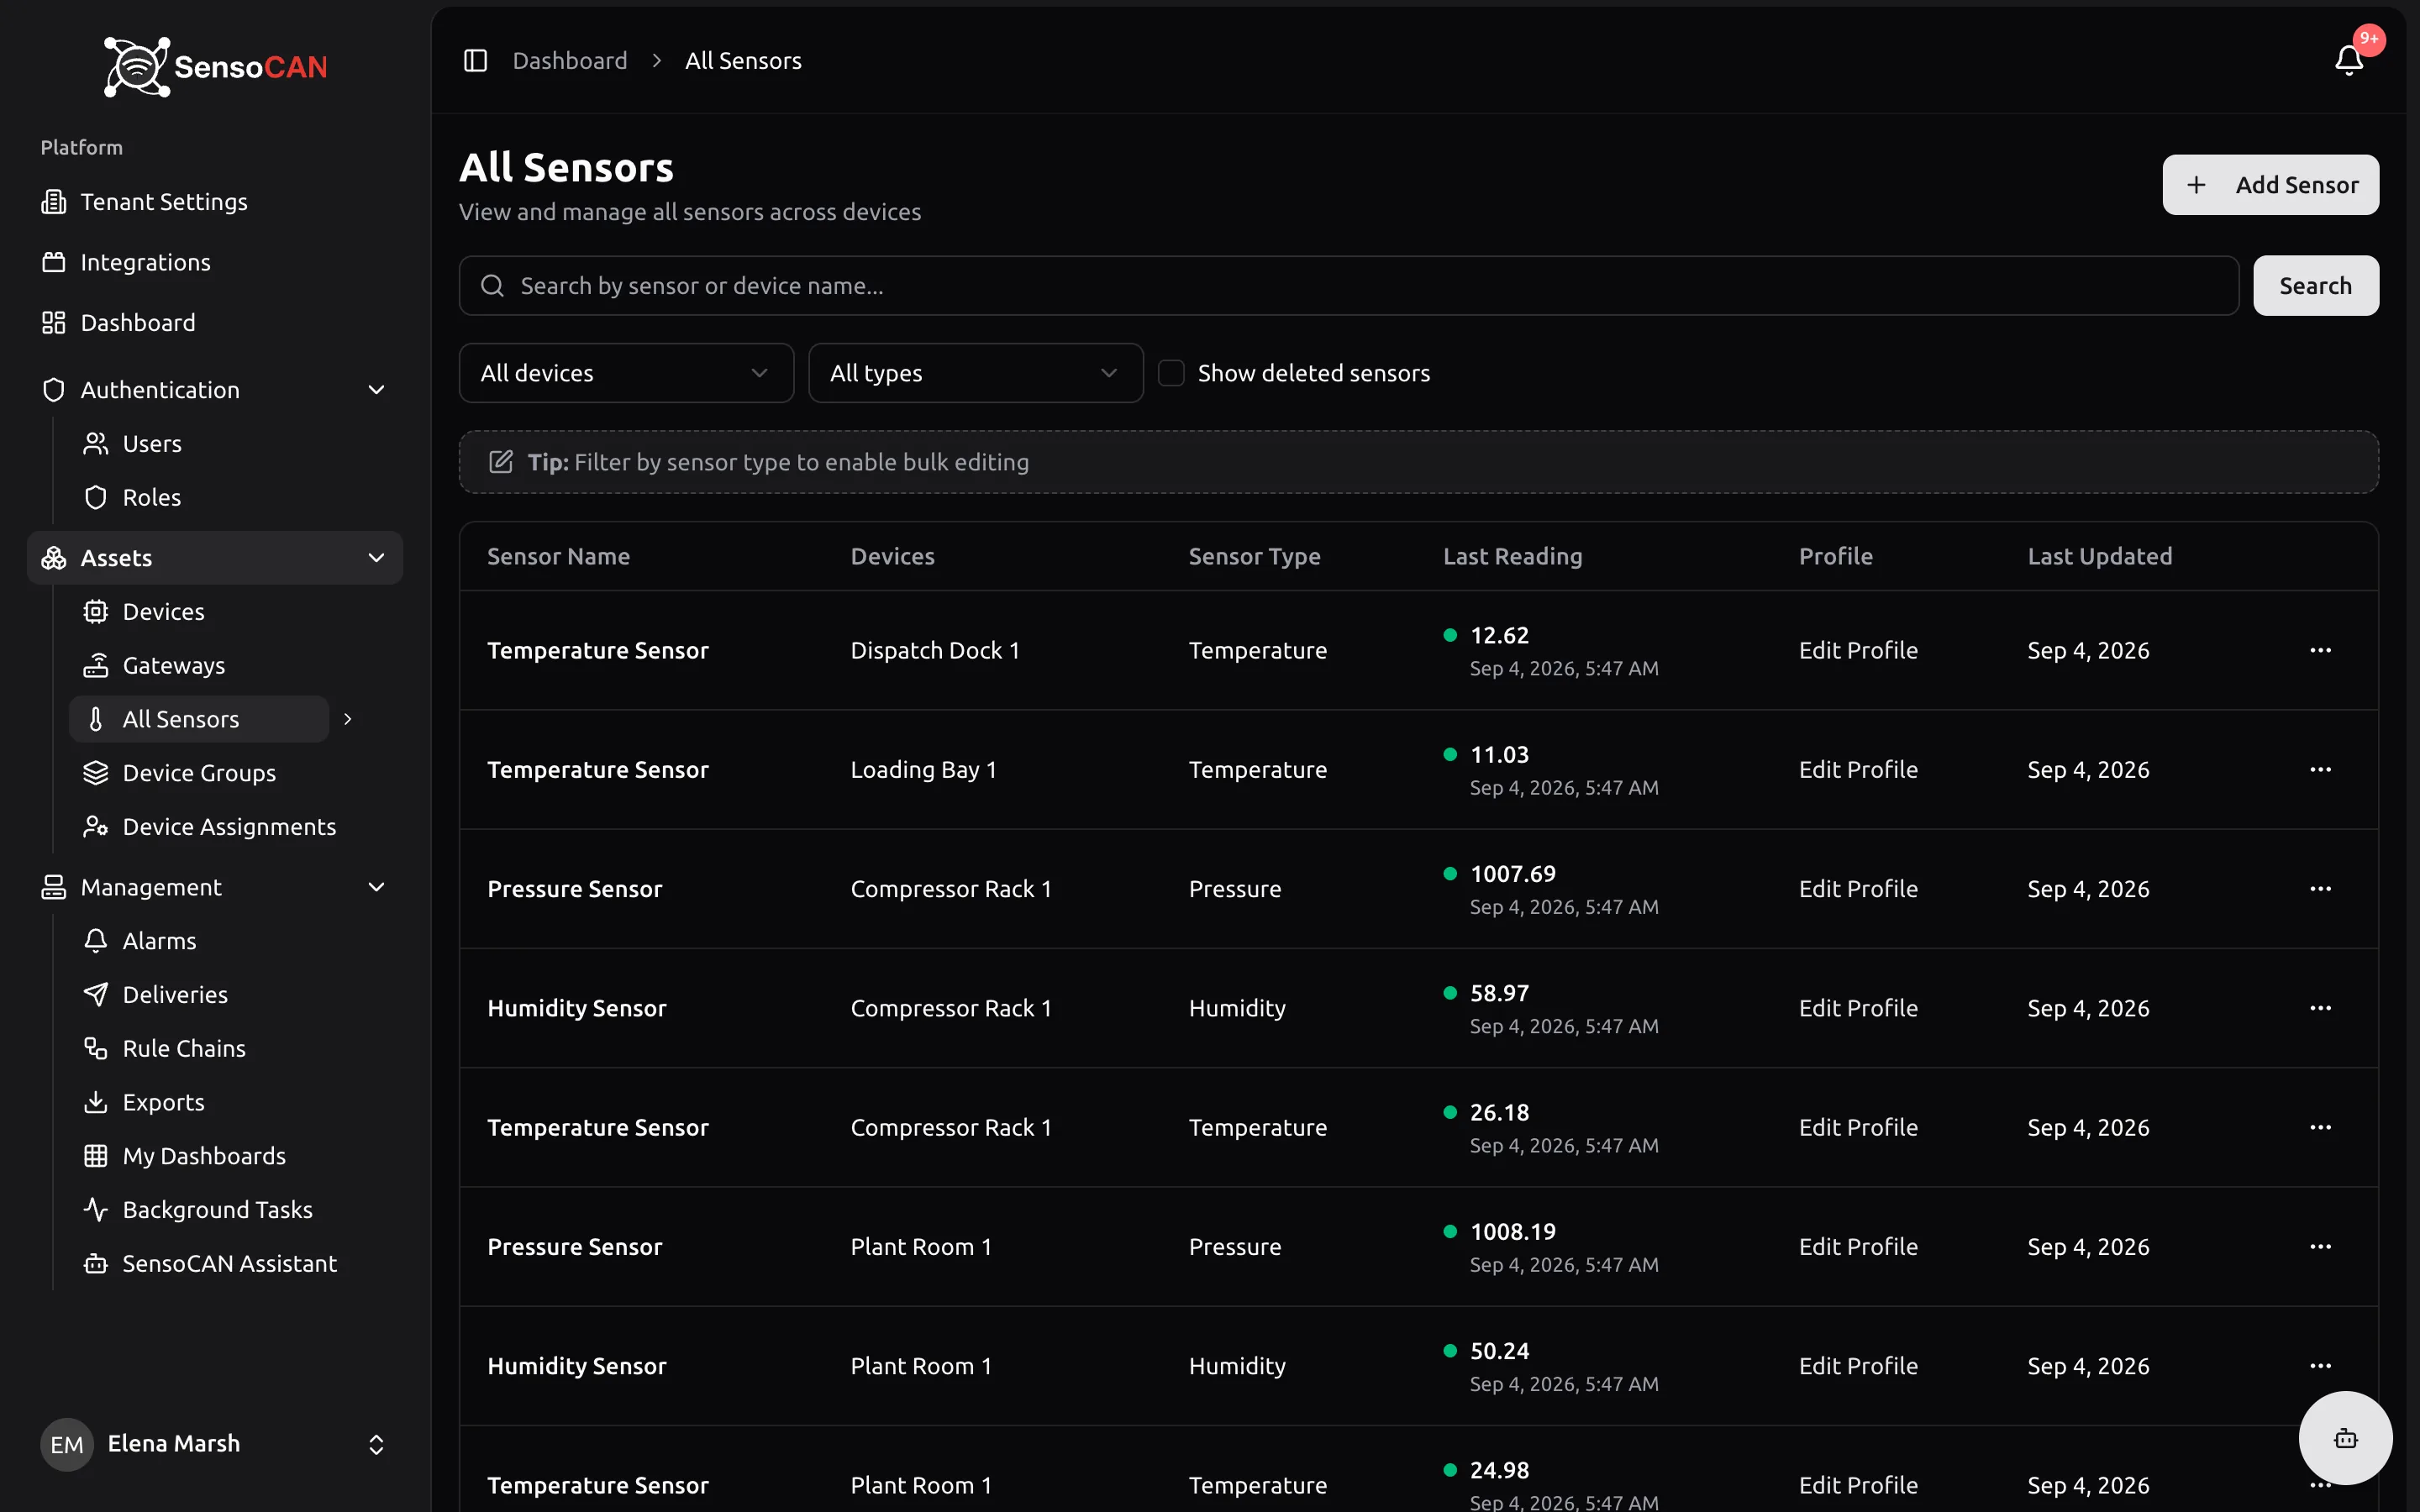
Filter by name (the search matches the sensor name, its slug or its device name), by device, by type, and tick Show deleted sensors to include deleted ones. The columns are Sensor Name, Devices, Sensor Type, Last Reading, Profile, Last Updated and an actions menu. Last Reading carries the value with its unit, its timestamp, and a coloured dot: green for "Sending data", grey for "No recent data", judged against the device's offline cutoff.
Bulk editing works one type at a time, which is why the tip bar reads "Tip: Filter by sensor type to enable bulk editing". Filter by type, tick the sensors, then Bulk Edit to set Unit, the thresholds, the sensitivities or the business hours across all of them. Each card has its own apply checkbox. Set the Email and SMS notification switches on each sensor's own profile page rather than here.
Delete sensor data
Delete Data on the sensor page removes readings while keeping the sensor. The dialog — "Choose how you want to delete sensor data" — offers Delete all data or Delete data within a date range with a Start Time and End Time, then a second confirmation spelling out exactly what you are about to erase and warning that it cannot be undone.
The work runs in the background: you get an immediate "Your data deletion request has been submitted. You will receive an email when it's complete.", then a mail when it finishes, telling you how many records went and over what range.
It deletes the raw readings, the hourly and daily aggregates and the threshold history for that sensor and range. The sensor, its profile, its slug and its UUID survive, so the device carries on reporting into it.
Delete a sensor
Delete in the sensor's actions menu asks "Delete Sensor?" and confirms that the sensor's data is preserved. Deleted sensors drop out of the normal lists but stay findable on All Sensors with Show deleted sensors ticked.
For a deleted sensor that menu offers Force Delete: "Permanently Delete Sensor? This will permanently delete the sensor and all its associated data. This action cannot be undone."
It removes the profile, the latest values and every raw, hourly and daily reading the sensor ever produced. Export anything worth keeping first.